From January to May 2026 I worked as an analyst on a consulting project, freelance. A food court. The task sounded simple: find out where the procurement money goes.
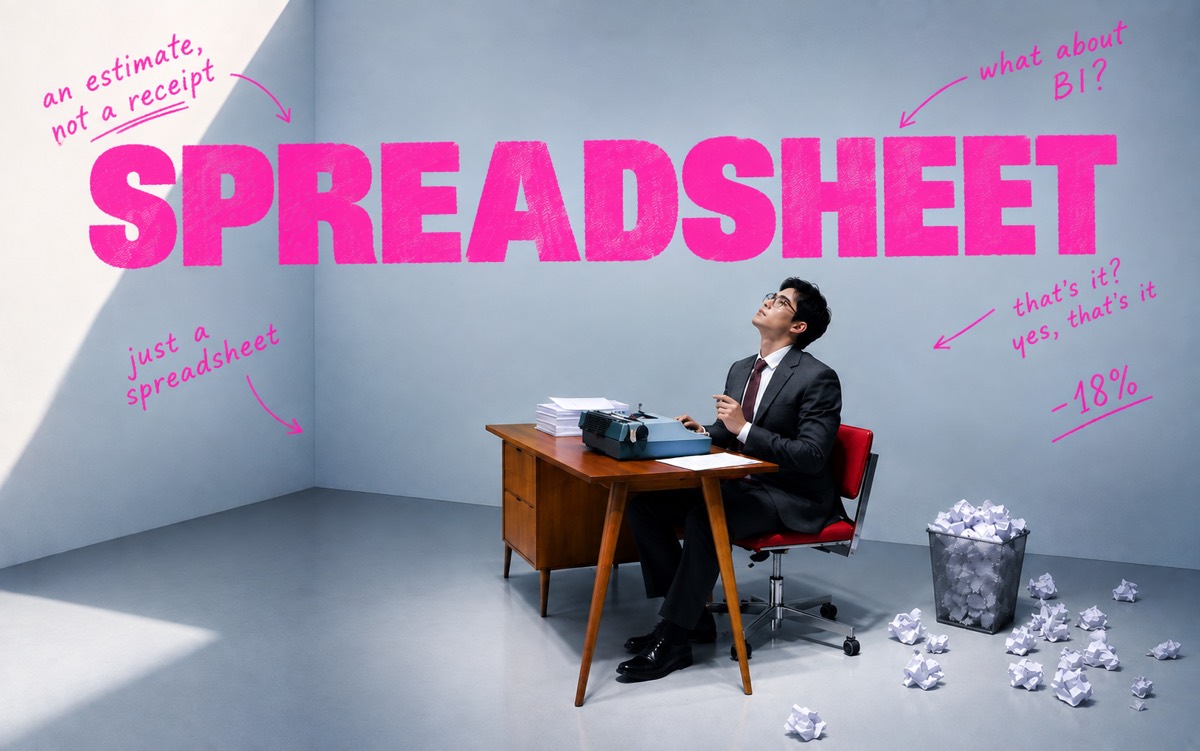
The tools: Google Sheets and Claude. That's it. Nothing else was needed.
The result: estimated savings of eighteen percent. The word "estimated" is the important one here, we'll get to it.
Why not BI
When people hear "data audit", they picture dashboards, integrations, a three-month rollout and people in vests who say the word "ecosystem" a lot.
Meanwhile a food court's data lives in Excel, in invoices, in chats with suppliers and in the head of whoever does the buying.
Before buying a system, you need to understand what you're going to put into it. Otherwise you'll pay for the rollout what you'd pay for a good car, only to look at the same mess a year later, just in prettier charts.
The most boring work
Get all the procurement into one place. Date, supplier, item, quantity, price, department. One table, one format.
It sounds like a one-day job for an intern. It's actually the longest and most important part of the whole thing.
While the data is smeared across five files, nobody has questions about it. Not because everything is fine, but because nobody can hold five files in their head at once. Put them side by side, and the questions appear on their own, in the same minute.
The dirt the model digs through
Real procurement data is never clean. Any of it is like this: the same item written different ways, a supplier sometimes in quotes and sometimes not, units sometimes in kilograms and sometimes in boxes. A person drowns in it within an hour.
And "other" in any procurement is its own cost category and its own load of crap: for years it's where everything goes that nobody could be bothered to sort.
This is where the model is genuinely useful. Sort the rows into cost categories, bring identical things to one form, flag whatever stands out from the rest. It doesn't get tired at row four hundred and doesn't start dumping everything into "other" by the evening.
It didn't decide anything. It sorted and pointed. A person drew the conclusions. Exactly the line I wrote about in the piece on the assistant that knows how to say "I don't know".
A report that counts by itself
An audit is done once. A hole you found quietly opens up again six months later if nobody is watching it.
So the second half of the work: a report on cost categories for every department that updates itself. Once a month you can see what went up, and what went up suspiciously.
The audit finds the hole. The report keeps it from opening back up.
Why "estimated"
Eighteen percent is the difference between how things were and how they will be if what was found gets fixed. How much was actually saved depends on what was done after I left.
It's very easy to round a number in a case study in your own favour: drop the word "estimated" and write "saved the client eighteen percent". Every other portfolio says exactly that. It sounds better and lies more.
What paid off
The spreadsheet is free. A subscription to the model costs incomparably less than a single delivery of supplies. Everything else is attention and the patience to work through rows nobody wants to look at.
An expensive system is worth it when you already know what you want to see in it. When you don't, start with a spreadsheet. At least it doesn't pretend to understand your business better than you do.